
These Were the Most Voter Friendly Cities in 2020?
These cities have adapted exceptionally to encourage voting in the historic 2020 general election.
To say that 2020 has been a consequential year is the understatement of the 21st century. The global pandemic, civil unrest, and growing effects of climate change are just a few of the major developments that the nation has experienced over the past year. 2020 is also host to one of the most highly-anticipated elections in recent history, and the events of these last nine months have only intensified the fervor of Americans to get out and vote.
Earlier this year, it was uncertain whether the coronavirus pandemic and subsequent social distancing regulations would hinder voter turnout in November. More and more eligible voters who are able to avoid going to polling locations in person on November 4th have been taking advantage of alternative voting options, such as early voting and mail-in ballots. In fact, rates of early voting this year are unprecedented: according to the Pew Research Center, mail-in voting this year has surpassed that of the 2016 election two times over. In 37 states (and Washington D.C., mail-in ballots have comprised just over 50 percent of this year’s votes. Additionally, the Washington Post reported that as of October 20th, 2020, early voting numbers across the nation have already exceeded those from 2016 by 10 percent.
Elections are foundational to American democracy, and it’s clear that voters are fighting to make sure their voices are heard in these unpredictable times. However, factors that contribute to voter turnout and encourage civic engagement vary across the nation. To understand these regional differences, the data science team at Insurify crunched the numbers and identified the most voter-friendly cities across the country.
Insights
- National averages. Across the United States, cities scored an average of 3.24 out of 10 for voter friendliness, which is the standard for a B-grade. The average number of USPS services per capita is 4 per 10,000 residents. The average county-level voter turnout rate for the 2016 Presidential Election was 41.81 percent. The mean state mail-in voting score ranked by the Brookings Institute is 11, or a B-grade.
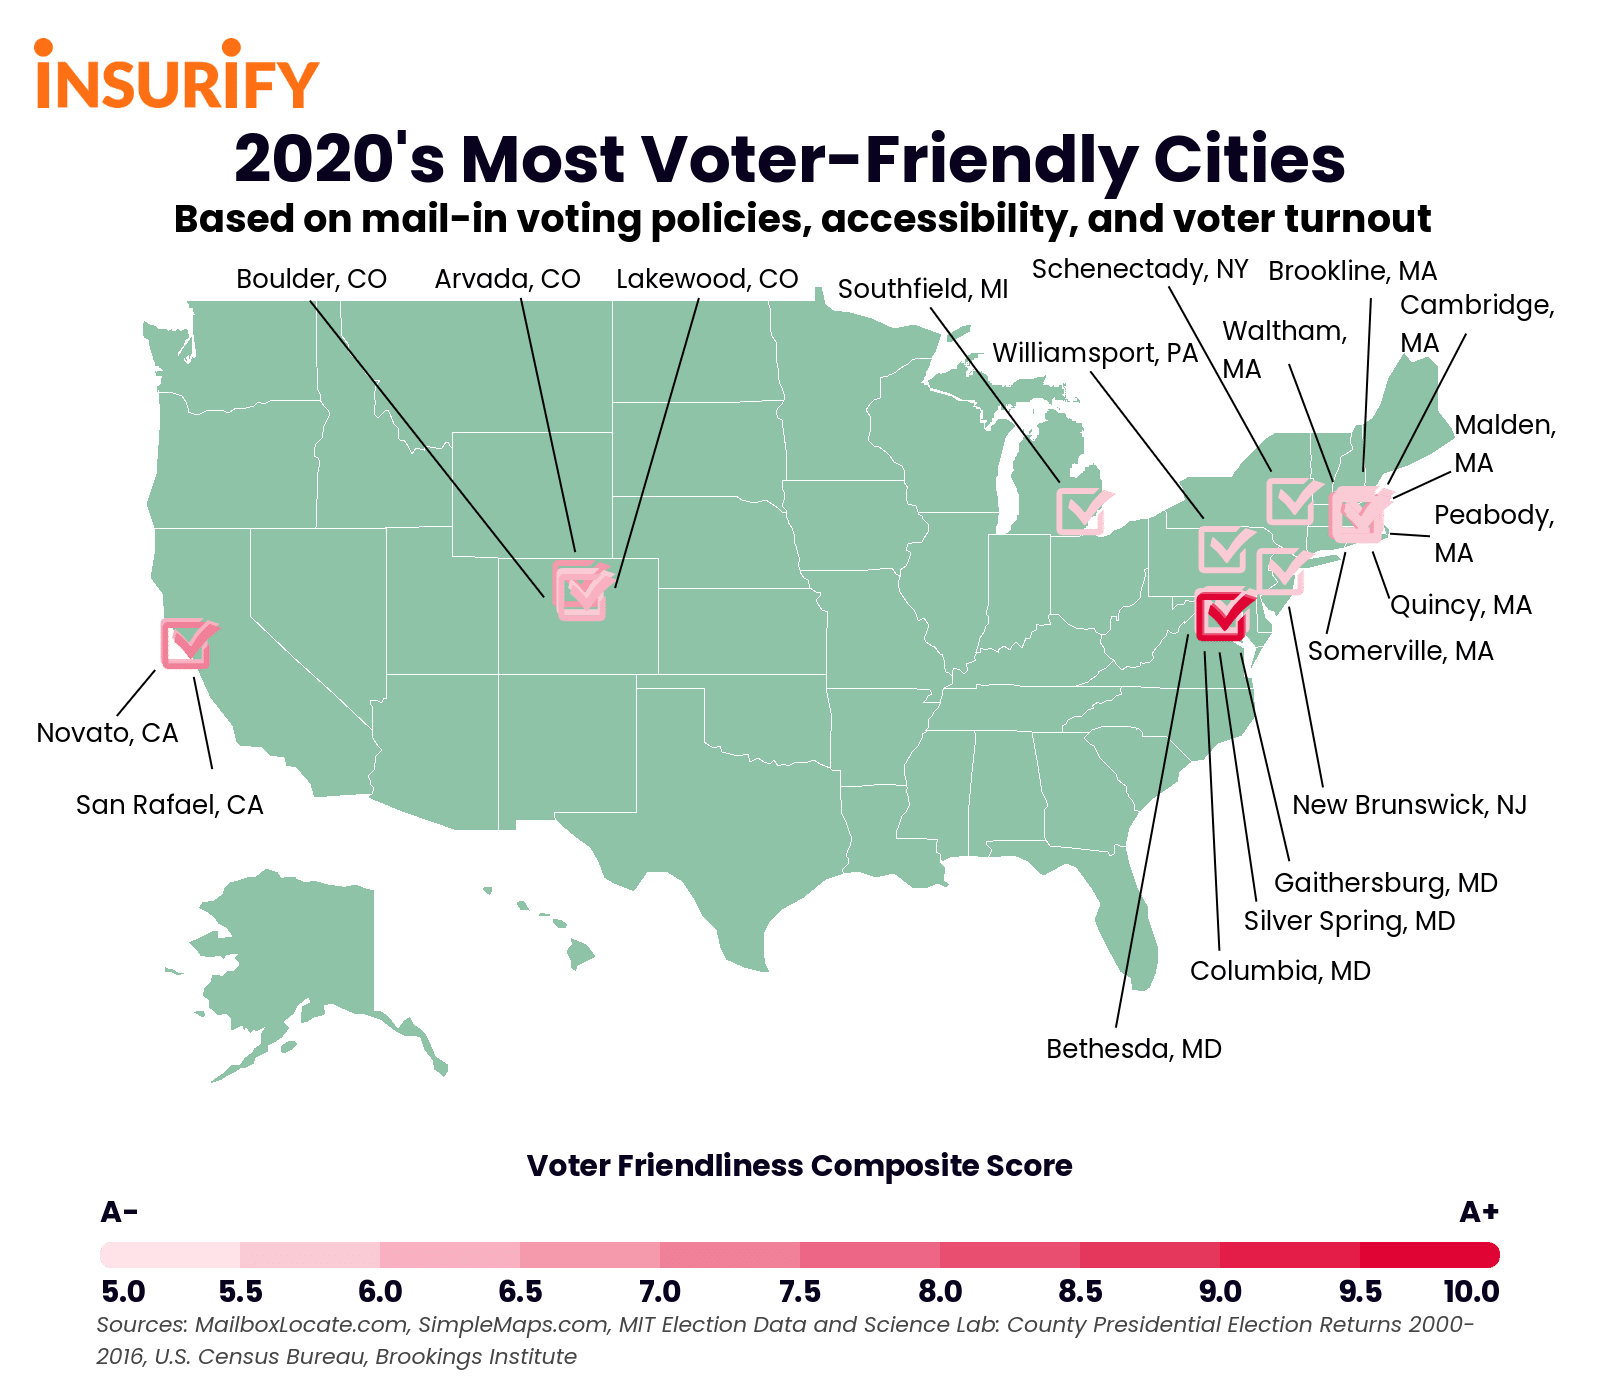
- Successful city clusters, but a lack of geographic diversity. Some states are overrepresented in the rankings of the most voter-friendly cities. Massachusetts, Maryland, Colorado, and California all have clusters of multiple voter-friendly cities. Massachusetts, with six cities on the list, is the most highly represented of the states. Even the cities that are the sole representative of their state are still located in the northeast. The lack of representation from the South may be attributed to their Brookings state mail-in voting scores — the majority of southern states received C grades or below, with the exception of North Carolina’s B rating.
- An exceptional outlier. The most voter-friendly city, Bethesda, which was the only city to earn an A+ grade, scored significantly higher than the next-best city on the list. The reason behind this city’s exceptionally high composite score ranking is likely its significantly high volume of USPS services per capita — at 37 per 10,000 residents, Bethesda has 22 percent more USPS locations than the next-highest voter-friendly city, and 90 percent more than the national average.
Methodology
The data science team at Insurify, a home insurance quotes comparison site, examined various public data sources to identify the most voter-friendly cities for the 2020 Election. Cities across the United States were evaluated across three metrics: USPS service availability (the number of USPS locations per capita), historical voter turnout (the county-level share of residents who voted in the 2016 Presidential Election), and mail-in voting infrastructure (the Brookings Institute’s 2020 State Mail-in Voting Scores).
Statistics on the number of USPS services (including both drop boxes and postal offices) were gathered from MailboxLocate.com, which tracks geographic data of USPS locations across the United States. To identify USPS services per capita, the number of USPS locations per city was measured against the city’s total population, provided by data from SimpleMaps.com. Previous voter turnout statistics were derived from the County Presidential Election Returns, 2000-2016 dataset provided by MIT Election Data and Science Lab. The total number of votes cast per county in the 2016 Presidential Election was measured over U.S. Census Bureau county population data to calculate voter turnout. State mail-in voting scores were provided by the Brookings Institute’s Pandemic Election Preparedness Project. States were ranked on a scale of 0-22 based on how effectively states implemented the following standards for the upcoming election: universal vote-by-mail, requesting an application for absentee voting, completing a mail ballot, submitting a mail ballot, channels for submission, and special scoring (such as ID and witness requirements).
A standardized composite score out of 10 was calculated for each city. In order to be eligible as a voter-friendly city, cities had to be located in a state with a mail-in voting score of 10 or above. Higher composite scores were indicative of greater resources and voter support, while lower composite scores were indicative of less infrastructure to support widespread voting. Each city was then assigned a grade, from A+ to F, based on how its composite score compared to the national average.

Most Voter-Friendly Cities in 2020
20. Somerville, MA
- Voter Friendliness Score: 5.27 (Grade: A-)
- Access to USPS Services: 12 per 10,000 residents
- Presidential Election Turnout (2016): 49%
- State Mail-in Voting Score (Brookings Institute): 13
19. Arvada, CO
- Voter Friendliness Score: 5.273 (Grade: A-)
- Access to USPS Services: 5 per 10,000 residents
- Presidential Election Turnout (2016): 58%
- State Mail-in Voting Score (Brookings Institute): 19
18. Gaithersburg, MD
- Voter Friendliness Score: 5.30 (Grade: A-)
- Access to USPS Services: 12 per 10,000 residents
- Presidential Election Turnout (2016): 46%
- State Mail-in Voting Score (Brookings Institute): 15
17. Columbia, MD
- Voter Friendliness Score: 5.31 (Grade: A-)
- Access to USPS Services: 10 per 10,000 residents
- Presidential Election Turnout (2016): 51%
- State Mail-in Voting Score (Brookings Institute): 15
16. Quincy, MA
- Voter Friendliness Score: 5.35 (Grade: A-)
- Access to USPS Services: 11 per 10,000 residents
- Presidential Election Turnout (2016): 52%
- State Mail-in Voting Score (Brookings Institute): 13
15. Schenectady, NY
- Voter Friendliness Score: 5.37 (Grade: A-)
- Access to USPS Services: 17 per 10,000 residents
- Presidential Election Turnout (2016): 44%
- State Mail-in Voting Score (Brookings Institute): 10
14. Williamsport, PA
- Voter Friendliness Score: 5.41 (Grade: A-)
- Access to USPS Services: 17 per 10,000 residents
- Presidential Election Turnout (2016): 44%
- State Mail-in Voting Score (Brookings Institute): 10
13. Peabody, MA
- Voter Friendliness Score: 5.43 (Grade: A-)
- Access to USPS Services: 13 per 10,000 residents
- Presidential Election Turnout (2016): 49%
- State Mail-in Voting Score (Brookings Institute): 13
12. Southfield, MI
- Voter Friendliness Score: 5.52 (Grade: A-)
- Access to USPS Services: 13 per 10,000 residents
- Presidential Election Turnout (2016): 53%
- State Mail-in Voting Score (Brookings Institute): 12
11. New Brunswick, NJ
- Voter Friendliness Score: 5.68 (Grade: A-)
- Access to USPS Services: 15 per 10,000 residents
- Presidential Election Turnout (2016): 40%
- State Mail-in Voting Score (Brookings Institute): 19
10. Malden, MA
- Voter Friendliness Score: 5.69 (Grade: A-)
- Access to USPS Services: 15 per 10,000 residents
- Presidential Election Turnout (2016): 49%
- State Mail-in Voting Score (Brookings Institute): 13
9. Cambridge, MA
- Voter Friendliness Score: 6.04 (Grade: A-)
- Access to USPS Services: 17 per 10,000 residents
- Presidential Election Turnout (2016): 49%
- State Mail-in Voting Score (Brookings Institute): 13
8. Lakewood, CO
- Voter Friendliness Score: 6.10 (Grade: A-)
- Access to USPS Services: 10 per 10,000 residents
- Presidential Election Turnout (2016): 58%
- State Mail-in Voting Score (Brookings Institute): 19
7. Novato, CA
- Voter Friendliness Score: 6.18 (Grade: A-)
- Access to USPS Services: 13 per 10,000 residents
- Presidential Election Turnout (2016): 53%
- State Mail-in Voting Score (Brookings Institute): 18
6. Boulder, CO
- Voter Friendliness Score: 6.39 (Grade: A-)
- Access to USPS Services: 11 per 10,000 residents
- Presidential Election Turnout (2016): 59%
- State Mail-in Voting Score (Brookings Institute): 19
5. Waltham, MA
- Voter Friendliness Score: 6.57 (Grade: A-)
- Access to USPS Services: 20 per 10,000 residents
- Presidential Election Turnout (2016): 49%
- State Mail-in Voting Score (Brookings Institute): 13
4. Brookline, MA
- Voter Friendliness Score: 6.60 (Grade: A-)
- Access to USPS Services: 19 per 10,000 residents
- Presidential Election Turnout (2016): 52%
- State Mail-in Voting Score (Brookings Institute): 13
3. San Rafael, CA
- Voter Friendliness Score: 6.99 (Grade: A)
- Access to USPS Services: 17 per 10,000 residents
- Presidential Election Turnout (2016): 53%
- State Mail-in Voting Score (Brookings Institute): 18
2. Silver Spring, MD
- Voter Friendliness Score: 8.06 (Grade: A)
- Access to USPS Services: 29 per 10,000 residents
- Presidential Election Turnout (2016): 46%
- State Mail-in Voting Score (Brookings Institute): 15
1. Bethesda, MD
- Voter Friendliness Score: 9.49 (Grade: A+)
- Access to USPS Services: 37 per 10,000 residents
- Presidential Election Turnout (2016): 46%
- State Mail-in Voting Score (Brookings Institute): 15
If you have questions or comments about this article, please contact insights@insurify.com
More From B93